This documentation is always evolving.This article focuses on the previous version of Mapcreator and its features. For this article about Mapcreator Next click here.
Need a map with the latest Canadian fire danger information from the Natural Resources Canada (NRCAN)? Need an interactive map that automatically updates with the latest data?
We have you covered with a layer containing a live feed of data with the current. Every day, this layer is updated with the latest data from the NRCAN, both in the tool as well as in any interactive output you create. Drop it on your website and you will have an automatic widget showing the latest information to your audience!
This is how you can get it to work:
Select the Fire Danger CA Layer from the list of Data Layers. If you don’t find this layer in your menu, please contact our Support Team.
In the elements list, you now see the FireDanger group appear:
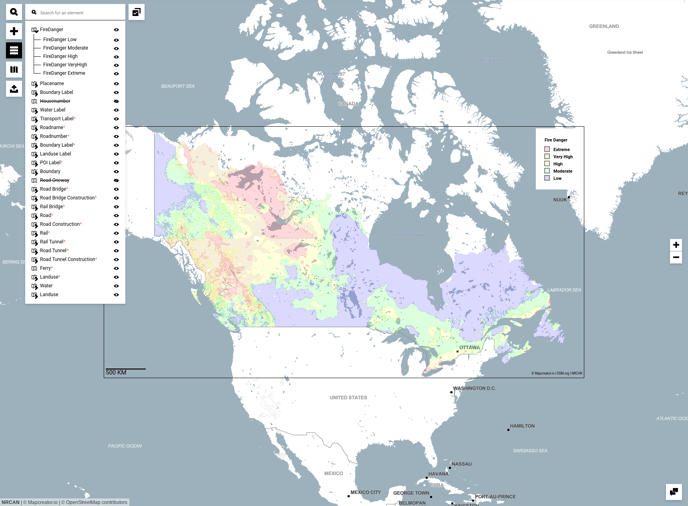
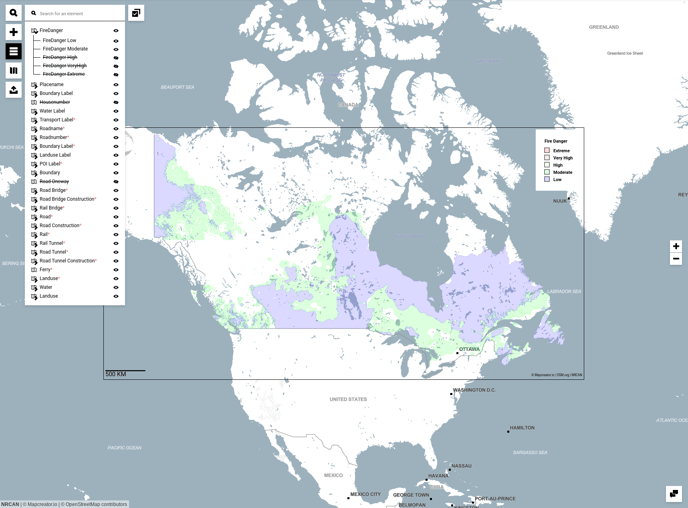
The elements in the FireDanger group represent the different levels of fire danger. You can select any of these to be shown or hidden individually.
Note that areas without any visible fire danger have no data. This means those areas are not safe necessarily.
How to get this map updated:
If you’d like to show this map on your website, we recommend you download this map as an iframe. The map published on your website will then also automatically update every day.
And on a static map?
That’s very simple. Go to “Open Project” to look for this map you’ve already previously created. Reload your map and it will automatically also have the most recent data of this hurricane. Download your map again and you’re ready.