Welcome to Mapcreator!
We are excited to have you and your team onboard. This roadmap will help you find your way through the onboarding process. Your involvement in the steps below is very important, and we appreciate your support in achieving a smooth onboarding for your team.
o Customization
- Map styles
- Icons and textboxes
- Data overlays
- Default workspace settings
o Team onboarding
- Workshops
- Ongoing support
Customization
In this section, you will learn about all the customization options, from map styles to workspace settings. You can take advantage of all the options, or use only some of them. As you go through this section, we recommend opening Mapcreator so you can easily see whether you want to keep certain settings as they are, or adjust them for your team.
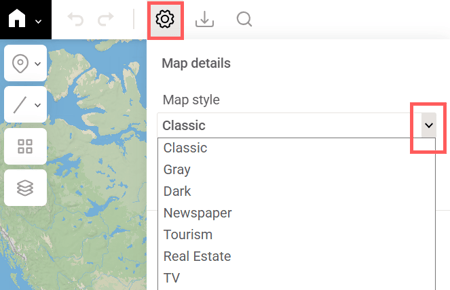
Map style
In the project settings, you can choose one of the available map styles. At the moment, you only see the default styles, but later we will replace them with your custom style(s).
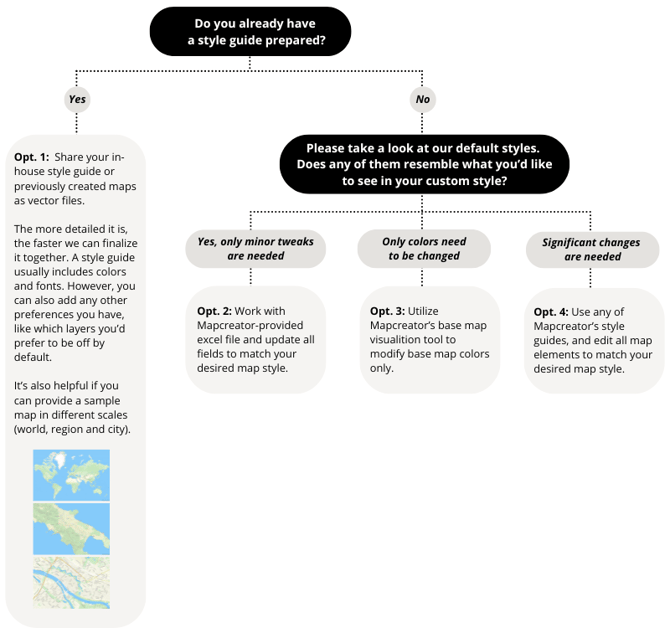
To start working on your custom map style, we’ll need a styling guide from your side. You can provide it in 4 different ways. The questions below will help you determine which option works best for you.
You can download the corresponding files here:
Opt. 2: Fill in one of the Excel files with your input: Classic style-based or Gray style-based.
Opt. 3: Update the colors, save, and share the results of the Base Map Visualizer.
Opt. 4: Open your preferred guide in Adobe Illustrator and adjust it as needed: base guide or extended.
Alternatively, you can create your own map style using our vector tiles in Maputnik. Please find a detailed guide here.
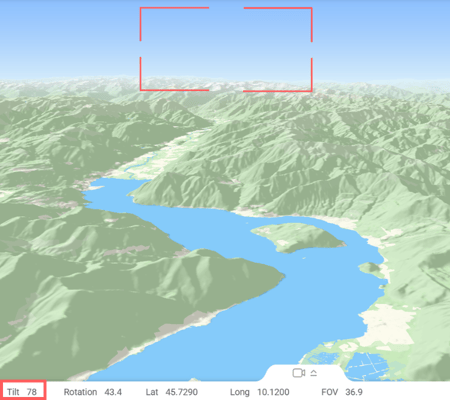
You can further customize your map style with the following sky settings:
-
Sky gradient for tilted maps (use this simulator to choose colors).
-
Sky color in Globe mode.
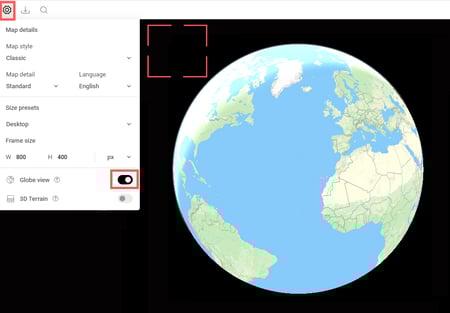
- Glare opacity in Globe mode.
Send the completed input together with the font files (.ttf or .otf) to Mapcreator. Depending on the level of detail, the first version will be delivered for an initial review within 5 working days. Additional adjustments can be made at any time.
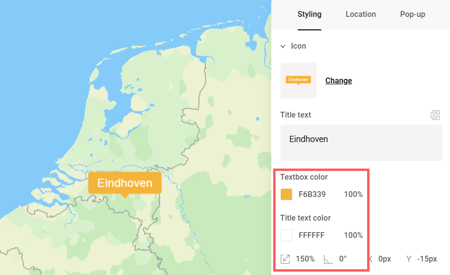
Icons and text boxes
In the first menu on the left, you’ll find the default icons and text boxes.

To add your custom icons and text boxes as separate sets, please provide them as vector files, sized as you’d like them to appear on your maps. For text boxes, please also send us your font in .ttf or .otf format and specify its size.
Users can modify element colors and sizes in the interface. If you'd like to disable this option for your custom icons and text boxes, please let us know.
After a technical feasibility check, Mapcreator will inform you whether all requests can be implemented.
Data overlays
The third tab contains live and static overlays. Click on them to activate.
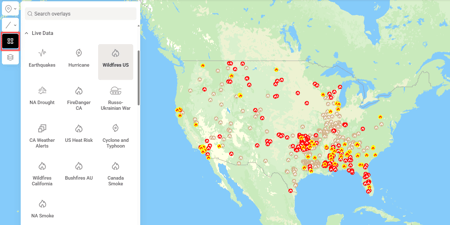
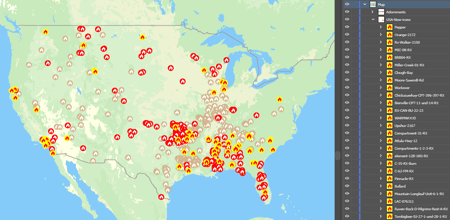
Lines, shapes, icons, and labels can all be customized. Please specify which overlays you’d like to customize and provide as many details as possible, such as font files, color codes, SVG with pattern, and so on.
Alternatively, you can activate an overlay and export your map as an SVG. When you open the SVG in Adobe Illustrator, you’ll see that all layers are editable. You can try out different styling options and send us the final version for implementation.
Mapcreator may also integrate your proprietary data layers. Please book a consultation with our team to discuss pricing, requirements, and feasibility.
Default workspace settings
The workspace can be customized to best support your team. These changes save time on repetitive tasks and keep your projects consistent.
Below you will find a list of settings that can be adjusted. If a setting is not relevant for your workflow, skip it and continue to the next one.
It may be helpful to open a new project and review the default settings considering the types of maps your team usually creates. This will help you decide if any adjustments would be beneficial.
The following settings can be customized with your input:
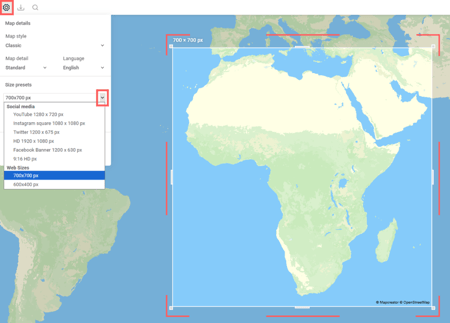
- Preset dimensions.
The map frame defines the area included in the final export. You can set it to HD or any other formats your team uses most frequently. Please send us your map dimensions, including the preferred units and name for each preset. Also, let us know which preset should be set as the default one. Your full collection of frame sizes will be available under Size Presets.
Please inform us if you’d also like to disable the option to resize the frame by dragging it.
- Initial view.
The default zoom level and coordinates.
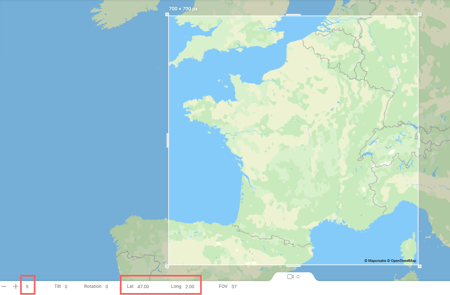
If your team usually creates maps focused on a specific country, it may be helpful to set a closer default zoom and adjust the coordinates to the center of that country. These are only the starting settings for a new project. Users can adjust them within each project.
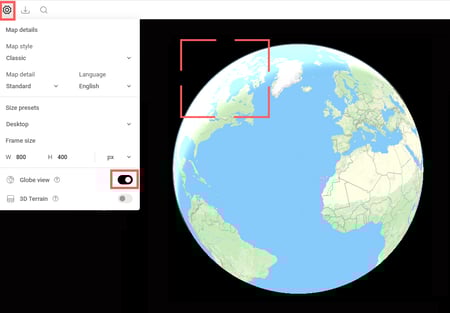
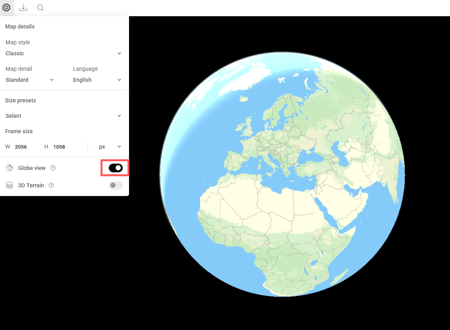
- Globe.
The Globe view can be enabled by default.
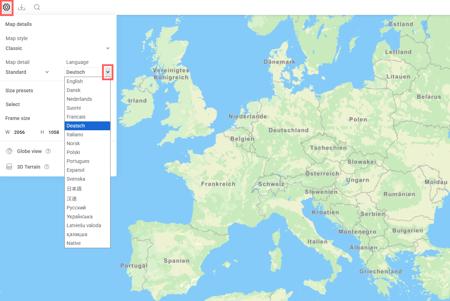
- Map language.
You can select the default language for map labels from the drop-down menu. Note that users can change this setting for their accounts.
- Units.
You can choose whether route lengths, circle radii, and other measurements are displayed in metric or imperial units. Note that users can change this setting for their accounts.
- Grid.
You can enable the grid by default and adjust the position of the guidelines. For example, to mark the lower third of the frame. Your team can manually move the default guidelines by dragging them, or we can lock them to prevent any changes.
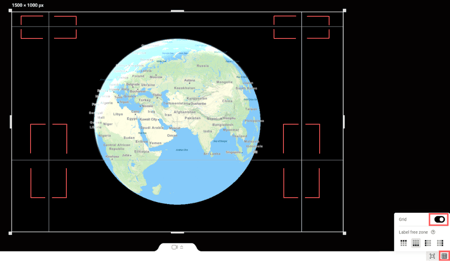
You can also activate any grid-based safe spaces.
Please let us know if these settings should apply to static maps, video maps, or both.
- Frame overlays.
You can enable preferred frame overlays by default and customize their settings as listed below.
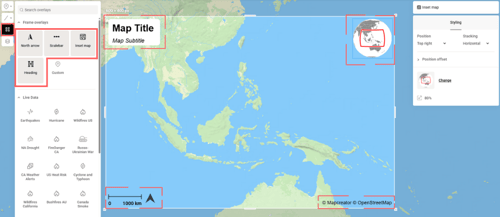
North Arrow: Screen position. Scale.
Scalebar: Screen position. Units. Scalebar color. Font size and style.
Heading: Screen position. Default Title text. Default Subtitle text. Font size, style, and text alignment for Title. Font size, style, and text alignment for Subtitle. Background visibility and color.
Copyright: Screen position. Orientation (horizontal or vertical). Font size and style.
- Default marker menu items.
You can choose whether Icon, Text box, or Text should be selected by default. The other 2 options will remain available in the drop-down menu.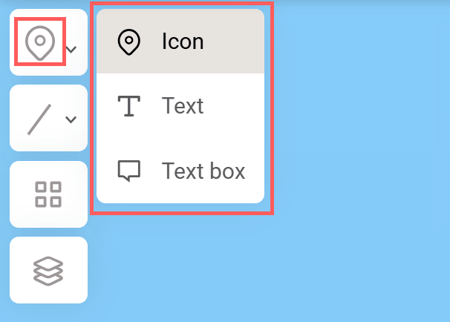
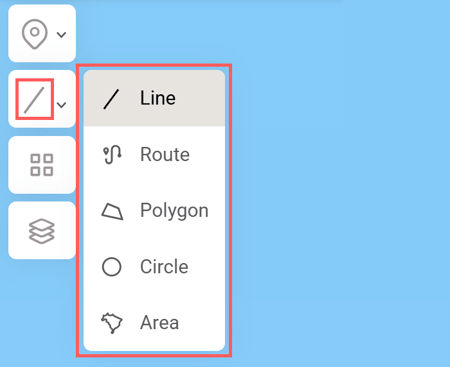
- Default shape menu items.
You can choose whether Area, Line, Route, Polygon or Circle should be selected by default. The other 4 options will remain available in the drop-down menu.
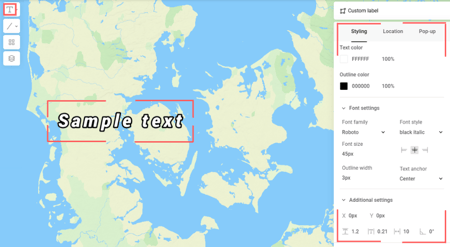
- Text styling.
You can define the default settings for Text elements.
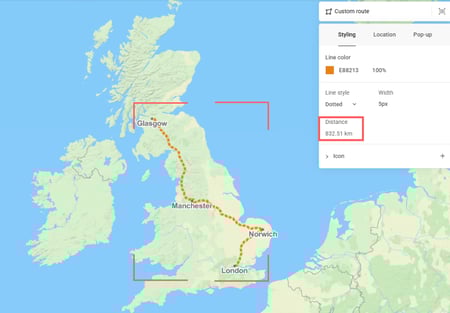
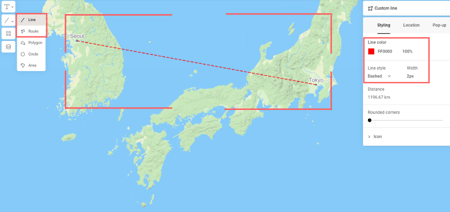
- Line and shape styling.
Area: Fill color and opacity. Outline color and opacity.
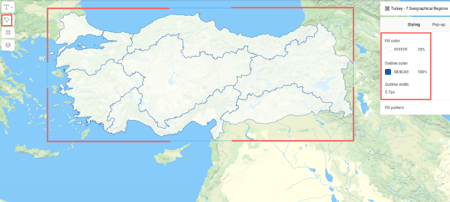
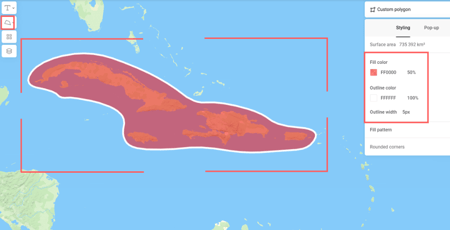
Polygon: Fill color and opacity. Outline color and opacity.
Line and Route: Color and opacity. Width. Line style (solid, dashed, dotted).
- Imported spreadsheet icons.
When importing a spreadsheet, circle icons appear at the specified coordinates. You can set the default color and radius for these icons. Drag and drop this XLSX file to import it and see how this works.

- Custom colors.
You can provide color codes and opacity values for your brand colors to add them to the palette.

Optionally, the color picker can be disabled. In this case, users will only be able to use colors from the palette for added elements (e.g. icons or lines).
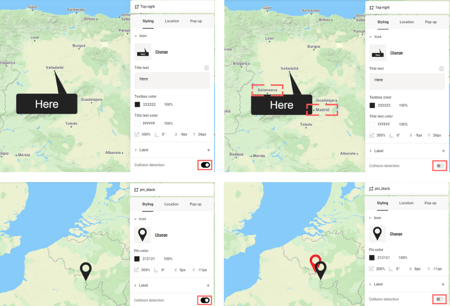
- Collision detection.
You can enable the collision detection by default for all added icons and text elements. In this case, when they overlap with other elements, the underlying ones will be hidden.
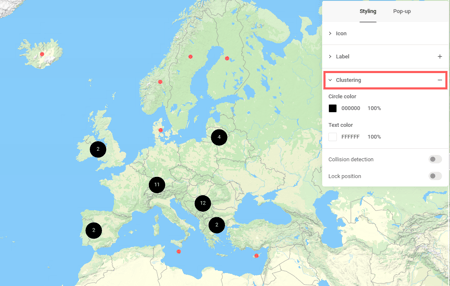
- Interactive maps (icon clustering).
If icons don’t have enough space to be displayed, circles showing the number of icons clustered behind them will appear instead. You can set the default style for these circles and numbers, as well as the zoom level at which clustering is disabled. To see this feature in action, you can drag and drop this XLSX file to import it, activate the clustering effect, and zoom out your map.
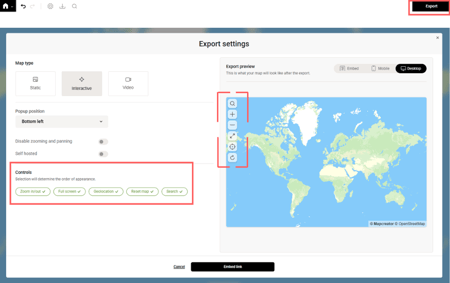
- Interactive maps (controls).
You can choose which controls should be enabled by default. You can also set their order and screen position. You can access the Interactive tab in the Export menu to see the available controls.
- Interactive maps (export).
There are two ways to export an interactive map: download a ZIP folder for self-hosting or use an iframe code. You can set self-hosted maps as the default option.
You can also set default width and height for the iframe, and provide a custom CSS string for styling the iframe.
- Video (keyframe transitions).
You can choose whether map style labels should be hidden or visible during transitions between keyframes. This is a default setting, your team can change it for each transition individually.
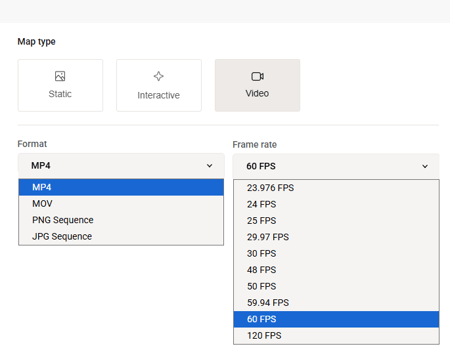
- Video (export).
You can set the default file format and frame rate for exported video files.
Please let us know if the current settings available in the interface don’t suffice, we’re able to provide more in-depth settings for advanced video types, such as custom FFmpeg codecs or WebCodecs.
- Export.
You can set the default file format for export based on what your team uses most frequently (SVG, PNG, JPG, TIFF, PDF, interactive, MOV, MP4, PNG sequence, or JPG sequence).
- Auto-save.
The default auto-save interval is 120 seconds. The interval can be changed, or disabled entirely.
Team onboarding
Workshop(s)
In the workshops, we’ll demonstrate how to use Mapcreator, covering both basic and advanced features to simplify and speed up your workflow. We’ll also show how to create different types of maps. Please share some frequent use-cases in advance so they can be included in the session. Questions from participants are answered throughout the workshop.
Scheduling
It’s up to you, if onboarding workshops are scheduled after the map style and assets are completed, or during. Usually, teams with a large amount of producers only join the workshops once the tool is ready for them and all settings are in place.
If your designers are ready to get started anytime, workshops can be scheduled immediately.
For experts, the group of attendees shouldn’t be more than 10.
For producers, smaller groups with no more than 5 attendees are recommended.
To schedule a workshop, reach out to your Mapcreator contact.
Ongoing support
We encourage you to stay in touch, even outside of workshops.
Have a question or need guidance on your project? Every team member can reach out to the Mapcreator support team via chat or email. Chat is the fastest way to get help, so we recommend using it for your daily workflow.

Our support team is available Monday to Friday, 09:00–21:00 CET (03:00–15:00 ET). If you reach out outside these hours, we’ll respond as soon as we’re back online.