You can add live data on smoke distribution across North America using Mapcreator. This data is updated hourly and comes from the National Digital Guidance Database (NDGD).
Where to find it
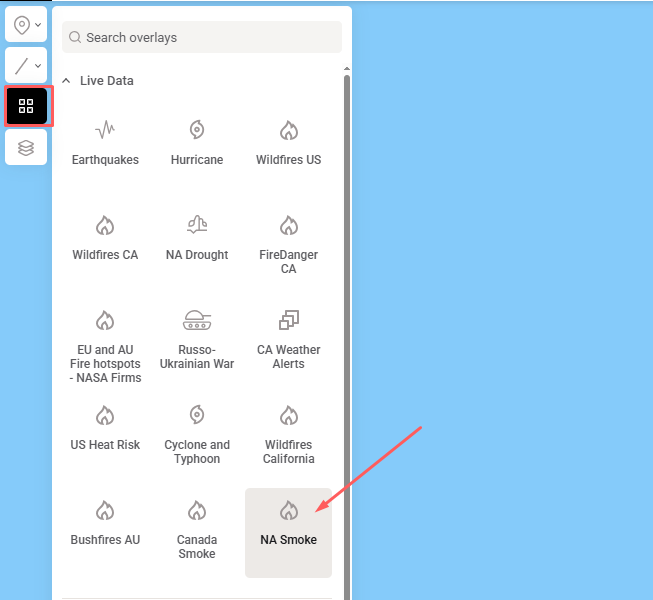
To display this data on the map, select it from the list of Live Overlays.
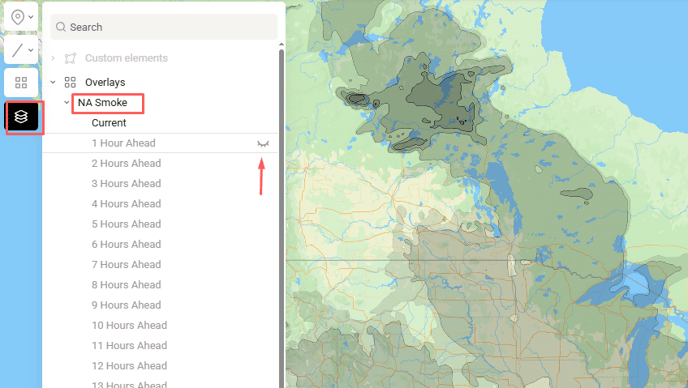
By default, the map shows the current smoke conditions. However, in the ‘’Layers’’ menu, you can select hourly forecasts for the next 24 hours. Click the eye icon next to the layers to toggle its visibility on or off.
How to get this map updated:
If you’d like to show this project as an interactive map on your website, we recommend you download this map as an iframe. The map will then also automatically update.
And on a static map?
The data in the tool is always providing the most recent updates. Meaning that if you reopen an existing project in the tool, it will automatically also have the most recent data. Download your map again and you’re ready.