This documentation is always evolving. This article focuses on the previous version of Mapcreator and its features. For this article about Mapcreator Next click here.
Need a map with the latest hurricane information from the National Hurricane Center (NHC) and the National Oceanic and Atmospheric Administration (NOAA)? Need an interactive map that automatically updates with the latest data?
We have you covered with a layer containing a live feed of data with the current status and predictions. Every 60 minutes, this layer is updated with the latest forecasts from the NHC, both in the tool and in any interactive output you create. Drop it on your website, and you will have an automatic widget showing the latest information to your audience!
This is how you can get it to work:
Select the Hurricane Layer from the list of Data Layers. If you don’t find this layer in your menu, please contact our Support Team.
In the elements list, you now see the Hurricanes group appear:
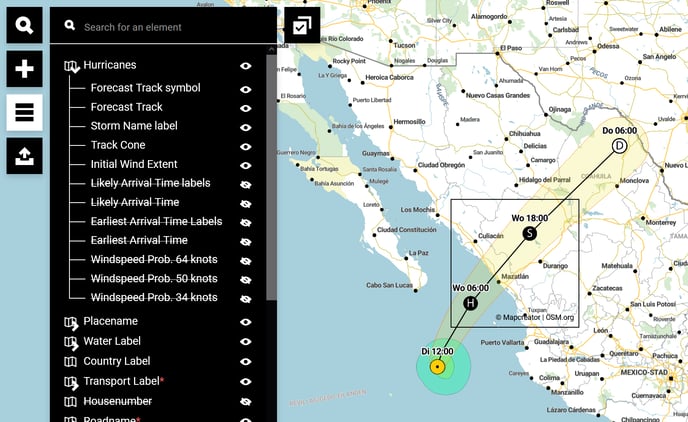
The elements in the Hurricanes group represent the different parts of the latest forecast we have selected to include in this layer. You can select any of these to be shown or hidden individually.
By default, the most traditional information is shown: the forecast track, the cone of probability with icons giving expected arrival time and intensity (H=Hurricane, S=storm, D=Depression) and the initial wind extent.
There are three versions of the wind speed probabilities:
- 34 knots (kt) (= 39.1 mph, 17.5 m/s, 57.4 ft/s, 63 km/h)
- 50 knots (kt) (= 57.5 mph, 25.7 m/s, 84.4 ft/s, 92.7 km/h)
- 64 knots (kt) (= 73.6 mph, 32.9 m/s, 108 ft/s, 118.6 km/h)
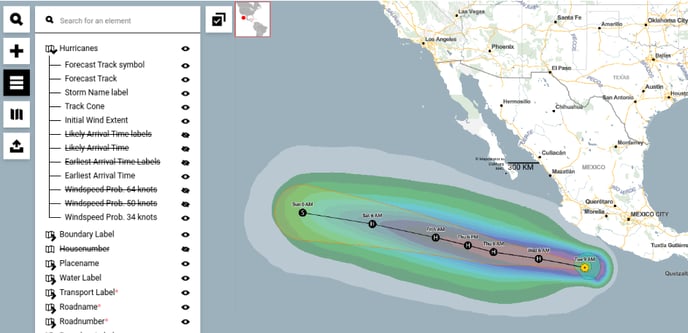
The colors of the probabilities depict the chance of that area to experience the given wind speed:
.png?width=212&name=FAQ%20-%20Hurricane%20layer%20(colors%20set).png)
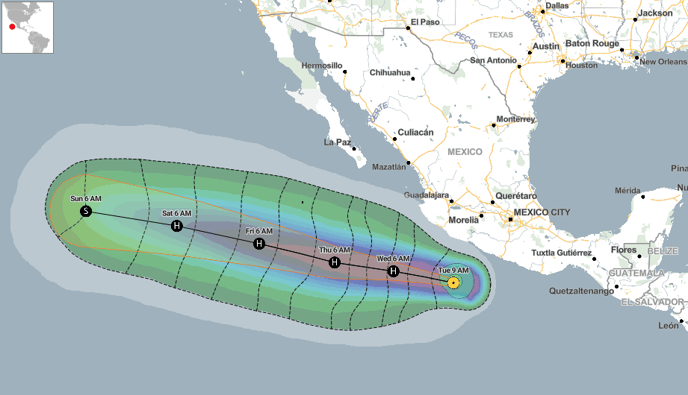
They can be overlayed with the likely or earliest arrival times:
How to get this map updated:
If you’d like to show this map on your website, we recommend you download this map as an iframe. The map published on your website will then also automatically update every 60 minutes.
And on a static map?
That’s very simple. Go to “Open Project” to look for this map you’ve already previously created. Reload your map, and it will automatically also have the most recent data of this hurricane. Download your map again and you’re ready.