.png?width=180&height=23&name=Mapcreator%20logo%20(1).png)
You can turn election data into a map in just a couple of steps.
Download this 2024 US presidential election data table and follow the steps below to see how it works.
Step 1. Import your data
Drag and drop a spreadsheet containing the electoral subdivisions and the data you want to visualize. This could be vote counts, winning candidates, or any other quantitative or categorical information you’d like to cover.
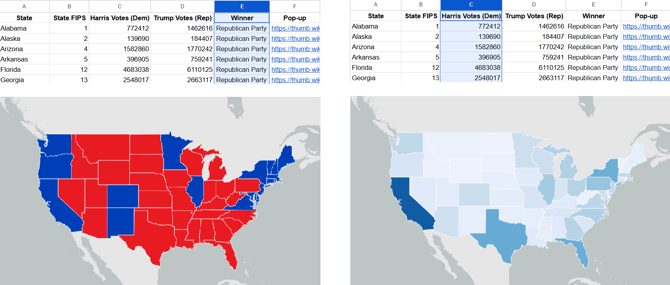
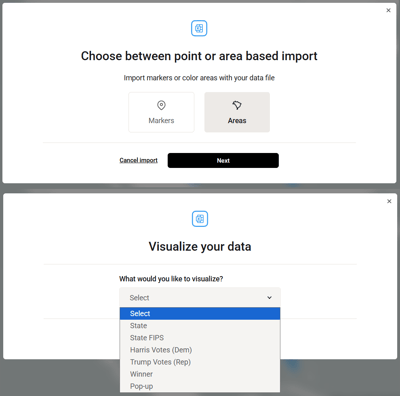
Mapcreator automatically recognizes the subdivisions by FIPS and other codes. Make sure your table includes a column with the relevant identifiers. After that, all you need to do is select ‘’Areas’’ and choose the column you want to visualize.
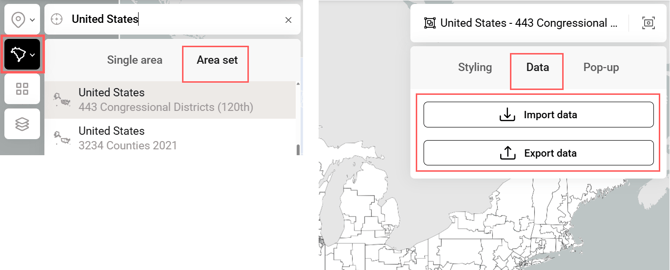
If you don’t have a table with the electoral subdivisions you need, find them in the ‘’Area set’’ menu and download a spreadsheet. Add your data, then import it back through the same menu.
Step 2. Style your map
Customize your map in the ‘’Styling’’ menu by assigning colors and adding a legend.
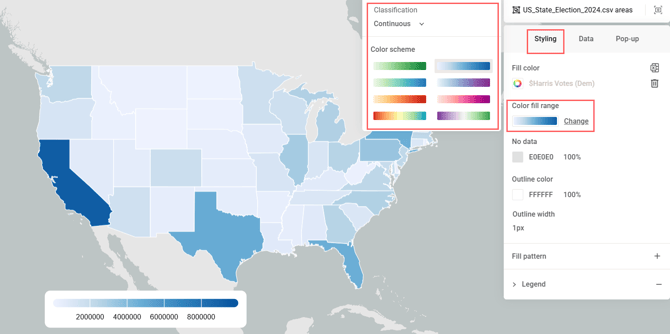
For quantitative data, choose from predefined color gradients and set the classification method.
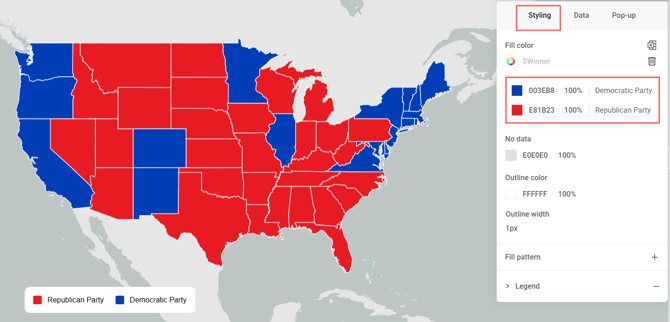
For categorical data, unique values are grouped automatically, and you can assign a color to each group.
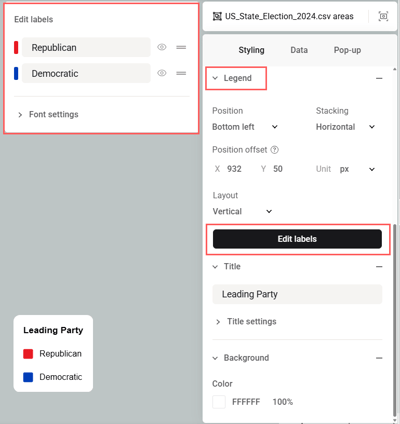
You can customize the legend by adding a background, changing its orientation, and adjusting the text style. You can also control how values are displayed:
- Categorical data: Click ‘’Edit labels’’ to reorder, rename, or hide labels.
-
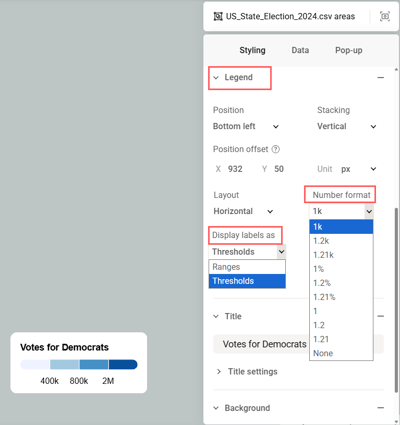
Quantitative data: Choose a number format and display values as ranges or thresholds.
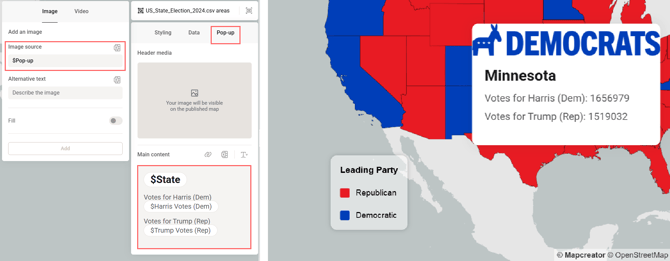
You can also make your map interactive by selecting a column containing the content you want to display in pop-ups.
Pro-tip
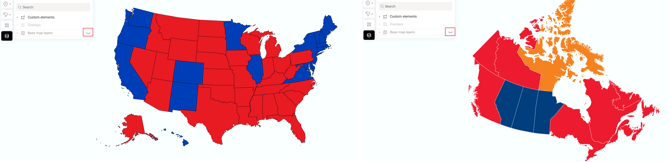
To display your map on a solid-color background, hide all base map layers by clicking the eye icon next to them. This is especially useful when working with datasets in non-Mercator projections, such as US states in the Albers projection or Canadian provinces in the Lambert projection.