Live data layers are layers that can be added onto your base-map. These layers include live data from highly reliable external sources. This layer is continuously updated in the tool and WEB exports as new data comes in from the source. This is, depending on the layer, every 30 or 60 minutes.
The live data-layers Mapcreator has available as of right now are:
| Sources | Time updated | |
| Earthquakes | USGS | every 60 minutes |
| Hurricane | NHC + NOAA | every 60 minutes |
| Wildfires US | NIFC | every 60 minutes |
| Wildfires CA | NRCAN | every 60 minutes |
| EU and AU fire hotspots | NASA firms | every 60 minutes |
| Ukraine war | deepstatemap.live | every 60 minutes |
| NA Drought | NADM |
daily |
| FireDanger CA | NRCAN |
daily |
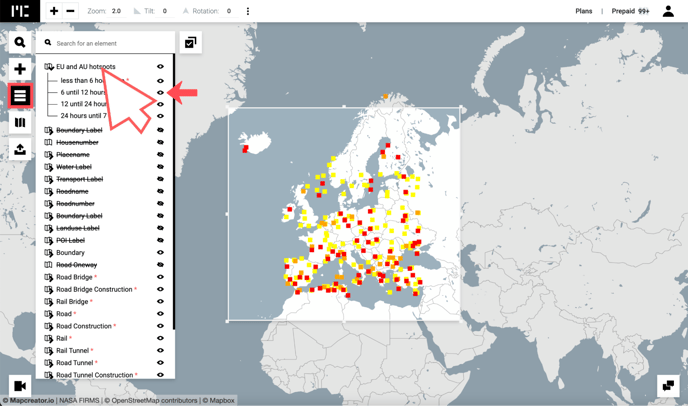
Live data layers can be found in the ‘’Data Layers’’ tab. You can use the search bar to find what you’re looking for or you can scroll down through the list to see what Mapcreator has to offer.

After adding the live data layer to your map, you can find it in the ‘’Elements List’’. You can click on the layer from this list to release the dropdown menu. Here, you can decide which elements of the layer you want to show. For example with wildfires, you can filter depending on the size of the fire and for earthquakes you can filter per day and time. To show or hide elements from this layer, simply click on the eye icon next to it. An eye with a stripe diagonally crossing it refers to an item that is currently hidden.
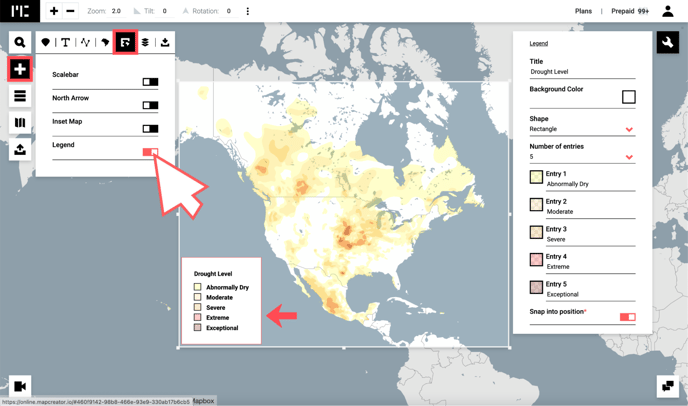
Some layers will have a legend that is automatically added to your map. This can be disabled, but can also be very useful to give your viewers or readers more insights on the situation. If you click on the legend, you can change the styling, change the title and add or remove rows. In case you want to fully remove the legend, you can toggle this option off in the ‘’Adornments’’ tab.
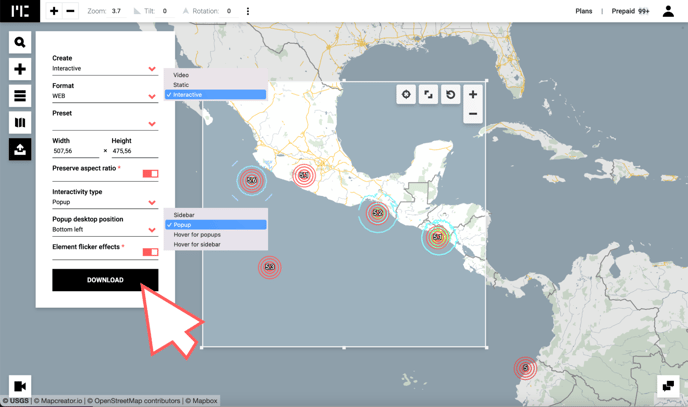
Maps can be downloaded as static, animated or interactive outputs. For live data layers, interactive is where you can use it to its full potential. In an interactive map, your viewers or readers can zoom, tilt and pan through the map. Once you download your project as an interactive map, an iframe will be generated. Embed this iframe in your website and your map will continuously update as new information comes in. Furthermore most of the live data layers have pop-ups with extra information that you can activate on hover or click.
Try it out for yourself in one of these interactive maps:
Wildfire Live Datalayer example
Hurricane Live Datalayer example
Ukraine war Live Datalayer example